Flowjar month stats: spending by category, biggest day and no-spend days
Flowjar's Stats view breaks each month into spending and income by category, then shows your daily average, your biggest day and how many no-spend days you had.
Short answer
In Flowjar, open Activity and choose Stats. For the month you pick, you see Total spent and Total earned, each broken down by category with the biggest first. Below that are three numbers about your days: Daily average, Biggest day and No-spend days. It's all worked out on your iPhone from the entries you've added.
A list of entries tells you what happened. A month summary tells you what it added up to. Flowjar puts both in the Activity tab, so a month review takes a couple of minutes instead of an evening with a spreadsheet.
Open Stats
Activity has three modes at the top: List, Calendar and Stats. Tap Stats, then pick a month in the month row under it. The row reaches back to the month of your first entry, up to three years. Flowjar remembers the mode, so if you leave Activity on Stats, it opens there next time.
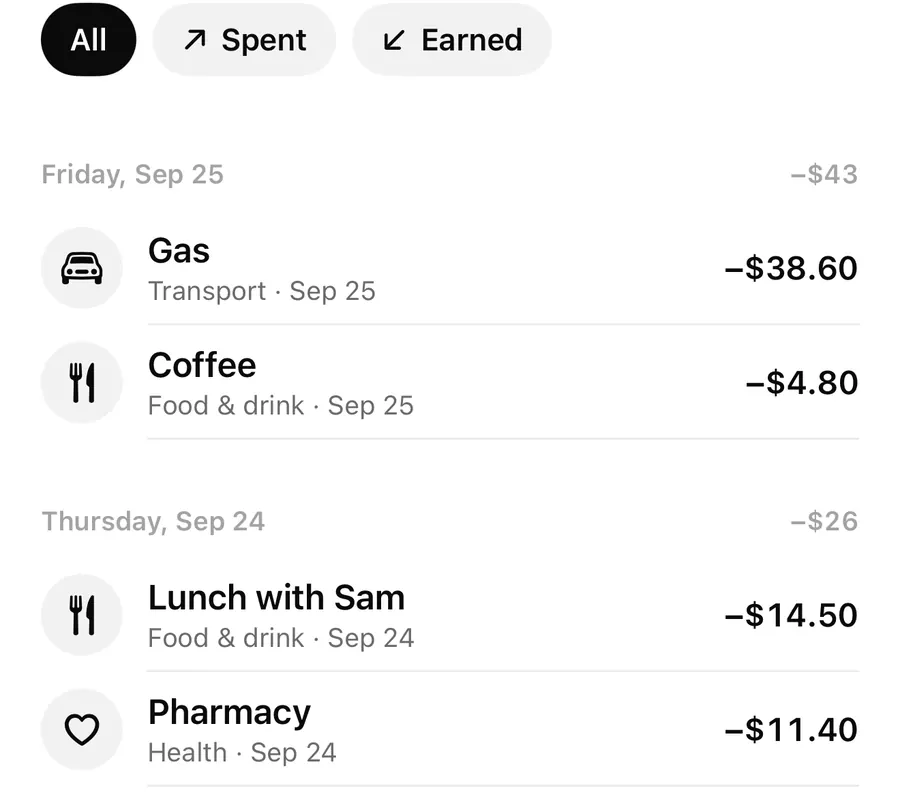
Stats replaces the entry list for that month. To see individual entries again, switch back to List; the Activity post covers List and Calendar.
Spending and income by category
The top of Stats has two cards side by side:
- Total spent: every expense in the month, then one line per category, biggest first.
- Total earned: every income entry in the month, then one line per income category, biggest first.
Only categories you actually used that month appear. If there's nothing on one side, the card says Nothing yet. Amounts are rounded to whole dollars here; the List shows the exact amounts.
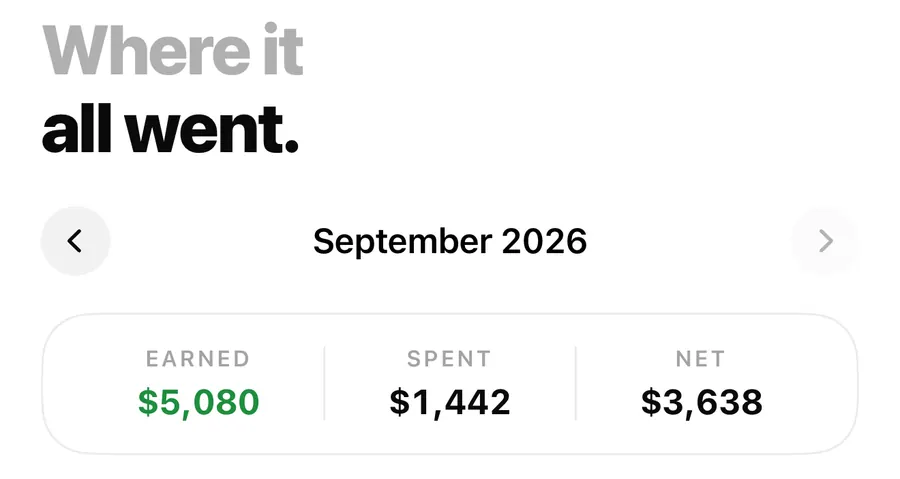
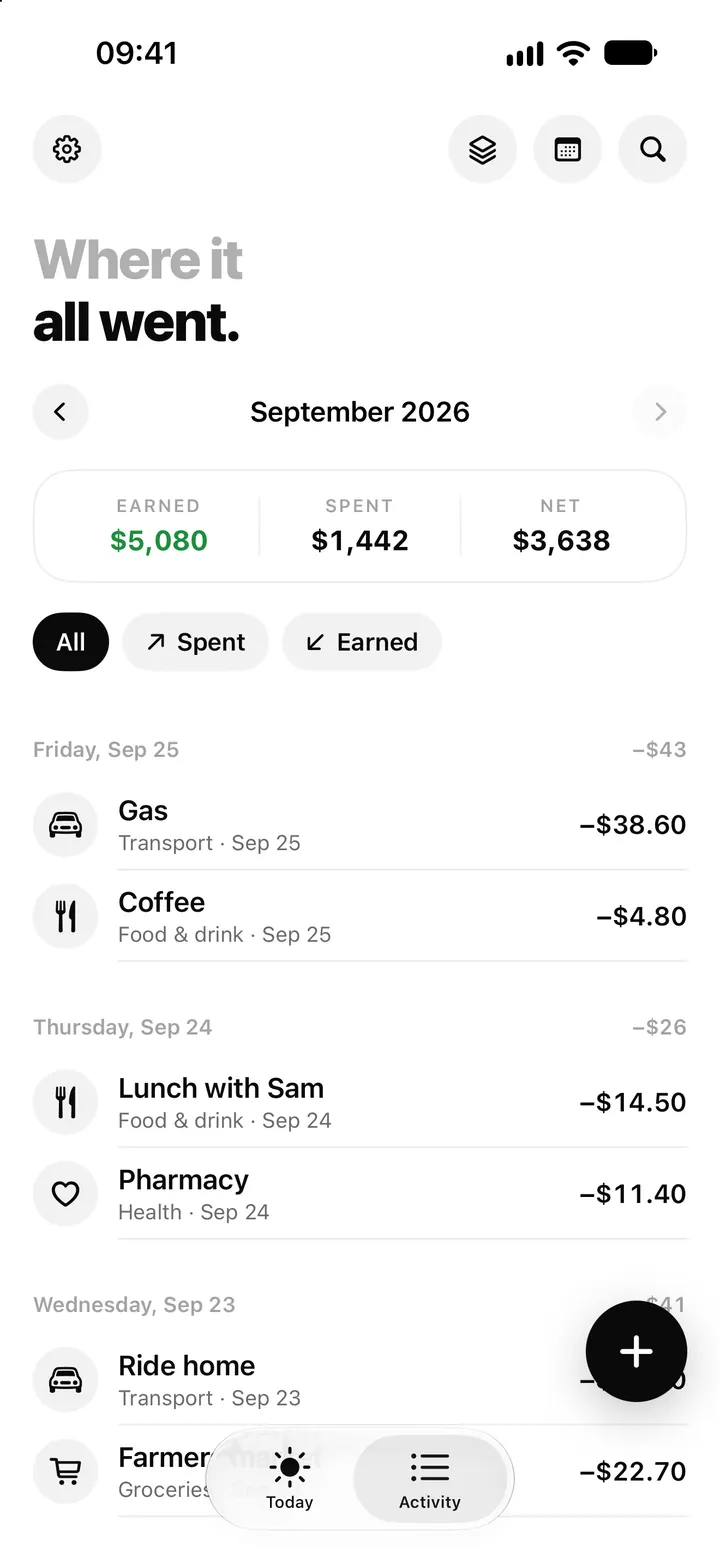
Total spent includes bill payments made with Pay, under the Bills category, so it matches Spent in the List summary. In the sample plan in the screenshots, September shows $1,442 spent and $5,080 earned. Stats would show the same two totals, split by category.
The categories Flowjar uses
Every entry has one category, chosen from a fixed list. There are 13 for spending:
| Spending categories | |
|---|---|
| Food & drink, Groceries, Transport, Shopping, Home | Day-to-day and household |
| Bills, Subscriptions, Health, Education | Regular and essential costs |
| Fun, Travel, Gifts, Other | Everything else |
And five for income: Paycheck, Side income, Refund, Gift and Other income.
You can't add your own categories, which keeps Stats readable but means an entry filed under Other stays there until you change it. Tap any entry in List to change its category, and Stats updates straight away.
Your days: daily average, biggest day, no-spend days
The bottom card looks at the month day by day, counting expenses only.
| Stat | How it's worked out |
|---|---|
| Daily average | Total spent in the month divided by the days of the month so far, including today. For a past month, that's every day. |
| Biggest day | The day with the most spending, with its date. It shows a dash if nothing was spent. |
| No-spend days | Days so far this month with no expense entries at all. Future days aren't counted. |
Two details make these easier to read:
- Bill payments count. The day rent is paid will often be your biggest day, and a day where you only paid a bill isn't a no-spend day. If you want a sense of everyday spending, look at the categories other than Bills.
- Today counts as it goes. On the current month, today is a no-spend day until you add an expense, and the daily average shifts as the month goes on.
This daily average is a look back. The forecast's estimate of a typical day is different: it leaves out bill payments and uses the last 30 days. See the forecast post.
A five-minute month review
Stats is most useful once a month, with the month that just ended. Here's a simple routine:
Review last month in Stats
- Open Activity, tap Stats and pick last month in the month row.
- Read Total spent against Total earned to see whether the month came out ahead.
- Look at the top two or three spending categories. Are they the ones you expected?
- Check Biggest day and its date. Was it a bill, or a one-off you'd rather plan for next time?
- Note your No-spend days and Daily average so you can compare next month.
- Switch to List and fix any entry in the wrong category, then come back to Stats.
Stats shows one month at a time; to compare, switch between months in the month row. If a category looks high, use search to pull up every entry with a word like lunch or gas. The month review guide and the month-end checklist suggest what to change in your plan afterwards, such as a jar share or a bill amount.
FAQ
Does Total spent include my bills?
Yes. Bill payments made with Pay are expenses in the Bills category, so they count in Total spent, Daily average and Biggest day.
What counts as a no-spend day?
A day so far in the month with no expense entries. Income on that day doesn't change it, but a bill payment does.
Can I see stats for a past month?
Yes. Pick it in the month row. It goes back to your first entry, up to three years.
Download Flowjar and see where this month really went.
Keep reading
Flowjar Activity: list, calendar and back-filling a missed day
Flowjar Activity shows every entry by month as a list or a calendar, with Earned, Spent and Net. Tap to edit, swipe to delete, or tap an empty day to fill it.
ReadSearch in Flowjar: find any entry, jar, bill or money tool in seconds
Flowjar search looks through your notes, categories, amounts, jars, bills and every app feature at once, and History keeps what you opened lately on the iPhone.
Read
Flowjar Free vs Pro: what's included, the plans and CSV export
Most of Flowjar is free. Flowjar Pro adds a 90-day forecast, unlimited jars and bills, and CSV export. See what each plan includes and what happens if Pro ends.
ReadA month-end money checklist in Flowjar
Review income, bills, large transactions, jars and forecast differences in Flowjar before starting the next month.
Read guide